Continuous Monitoring for Gaming and LLM
Apr 23, 2025
Recently, me and my wife got hooked into playing It Takes Two on our tiny little spare time. And being the DevOps engineer that I am, I was curious as to how my PC resource consumption looks like when used for gaming compared to just casual use case. Oh, on top of that, though pretty late into the game, I recently got my hands dirty with running some LLM models locally on my PC, and I am interested in knowing the wattage and GPU temps when running that. So in this post I will explain how I monitor my personal computer’s resource consumption over time.
My PC is based off of AMD Platform. Specifically Ryzen 5 5600G x RX 6600 XT. I have both Windows and Linux (Ubuntu) installed on separate SSD as my operating system. Most of the time I will be on Linux to code, browse, etc, but as I mentioned earlier I started playing It Takes Two which is only available on Windows in Steam. And since my primary coding OS is Linux, I set up a local LLM on Linux as well to hopefully help with code completion and general inference. So I need to setup resource monitoring for both OSes. The objective is that I would be able to check the metrics via Grafana Dashboard running on my homelab.
Windows Resource Exporter
I am quite familiar with Linux monitoring since it is included in my daily job responsibility package, but have zero experience working with Windows machine on that regards. As the saying goes, Eat the frog, I went to research about ways to gather and export resource on Windows specific machine. After a bit of googling (and GPT-ing), I found this prometheus exporter for windows, which is amazing. It exports some basic metrics like cpu, memory, etc. Unfortunately for me, however, it doesn’t export GPU specific metrics, which is a big deal breaker for me since GPU is the main thing I want to monitor. There is also a discussion here which explains that As a general rule we avoid the use of external binaries with this exporter, instead preferring to source metrics directly from the OS using Perflib or WMI which is why GPU metrics is not included since it would likely require external binary (idk)
The search continues ~
I found another promising tool, Open Hardware Monitor, but it is no longer maintained (the github repo last update is from 2020). That’s when I found this Libre Hardware Monitor which is, as the mentioned in their github readme file, a fork of Open Hardware Monitor. It is still actively being developed, it supports Intel and AMD processors and graphics cards. It also have other interesting metrics like network and drives.
Sweet! (I say)
It has WebUI that shows instant value of metrics when visited.
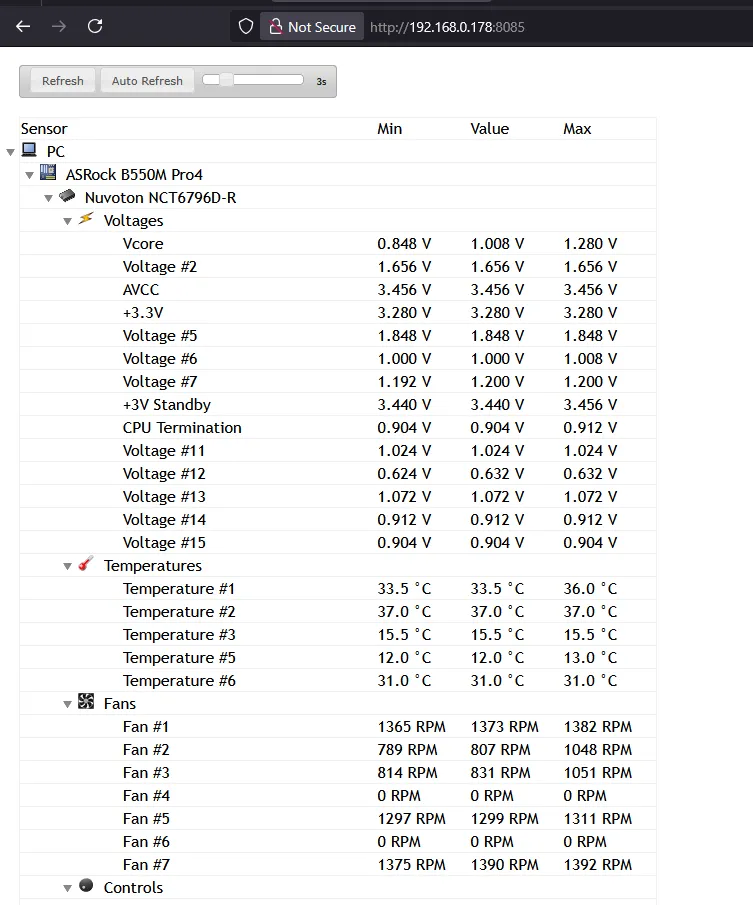
Initially, my idea is to create a simple scraper that will visit that WebUI, parse the data, and then serve it in a form that prometheus scraper accepts. But then I realize that it can be used as library (they even say it in the Readme, Indonesia does have a literacy emergency). Now, on to the next challenge, I have roughly zero experience with C# (aside from my attempt to do game programming many years ago using Unity). But with the help of Chat GPT and a little bit of improvization, I was able to cobble together a little program to utilize the librehardwaremonitor library to provide a prometheus-friendly metrics web server.
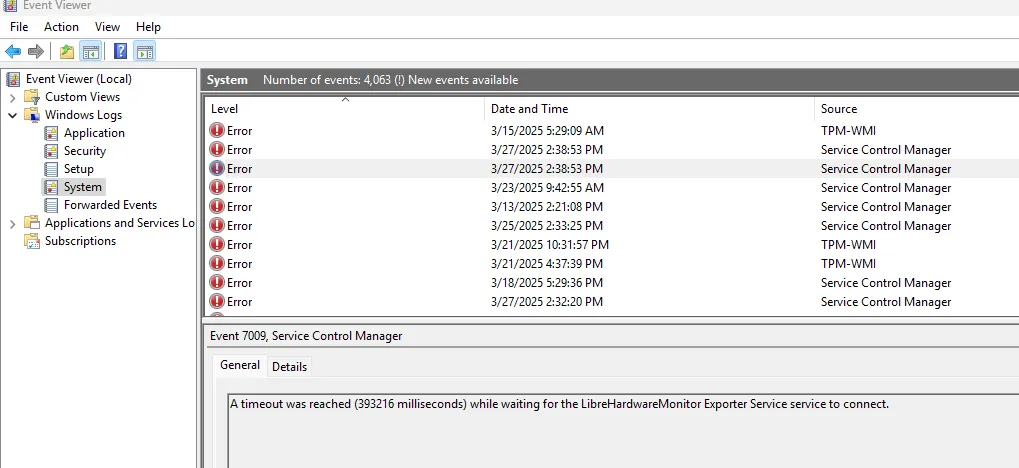
Here is my very first attempt, ChatGPT recommends that I run dotnet new web -n librehardwaremonitor-exporter to initialize the project and followed up by giving me sample code. I tested it by running the program manually and it works. I then asked Chat GPT to turn that into a Windows service. That is until I turn off my computer and use it again some other time, somehow the service won’t start, complaining a timeout was reached. I read this post and tried to increase the timeout to no avail.
I got stuck for a while (several days), and then I finally come to my sense and just use the old fashioned googling jutsu. And of course I immediately found the solution via the following tutorial. The tldr is, create a worker type application (using dotnet cli or just use visual studio), then you need to add the following line to your main builder:
...builder.Services.AddWindowsService(options =>{ options.ServiceName = "Librehardwaremonitor-Exporter";});...Oh and by the way, we need to open the designated port in our firewall to allow prometheus scraper. I just followed this tutorial and it is pretty straightforward.
It doesn’t immediately work for me though, for a while it still complains about timeout error, but somehow it works after I opened the compiled program for the first time. I think the compiled program required some permission that needed to be approved first. Nevertheless, it works now. This is the source code that I ended up using: github.
Linux Exporter
The linux side of thing is way more straightforward. After a bit of googling, I found that for my setup I would want to use the following tools:
Creating a service in linux was super easy. In my case, I use docker to spawn exporter container then set it to always restart so it will automatically be started on reboot. If I chose to go bare metal I would imagine it will be as straightforward as creating systemctl file.
#!/bin/sh
docker run -d \ --device=/dev/dri \ --device=/dev/kfd \ -p 9182:5000 \ --name rocm-device-metrics-exporter \ --restart=on-failure \ rocm/device-metrics-exporter:v1.0.0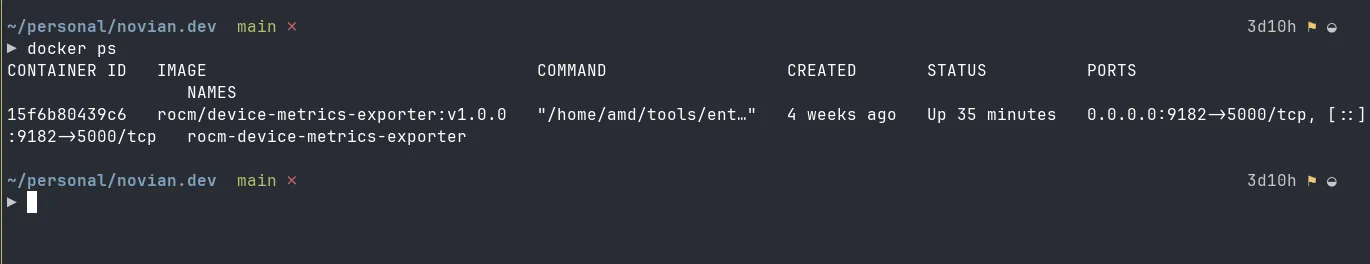
They even provided a sample dashboard here. But I will need to tweak that to suit my use case (it seems like the dashboard is focused for multi GPU use case).
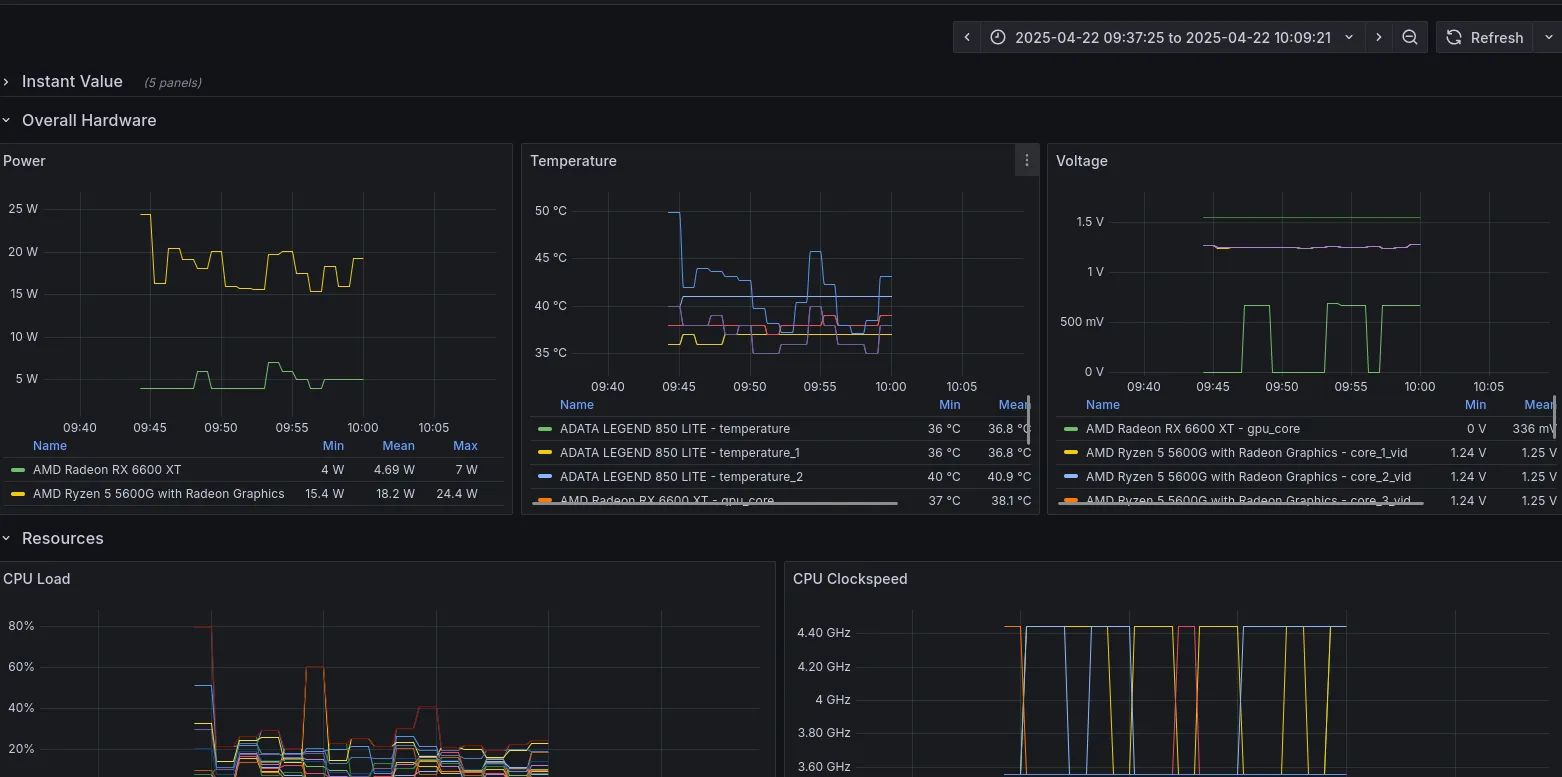
Here is how my PC resource looks like when running koboldcpp using the following command (100% of layers are offloaded to GPU):
#!/bin/sh
python3 koboldcpp.py --threads 6 --blasthreads 6 --usecublas mmq --gpulayers 33 --blasbatchsize 256 --contextsize 8192 --model /home/naivon/Downloads/Meta-Llama-3.1-8B-Instruct-Q6_K.gguf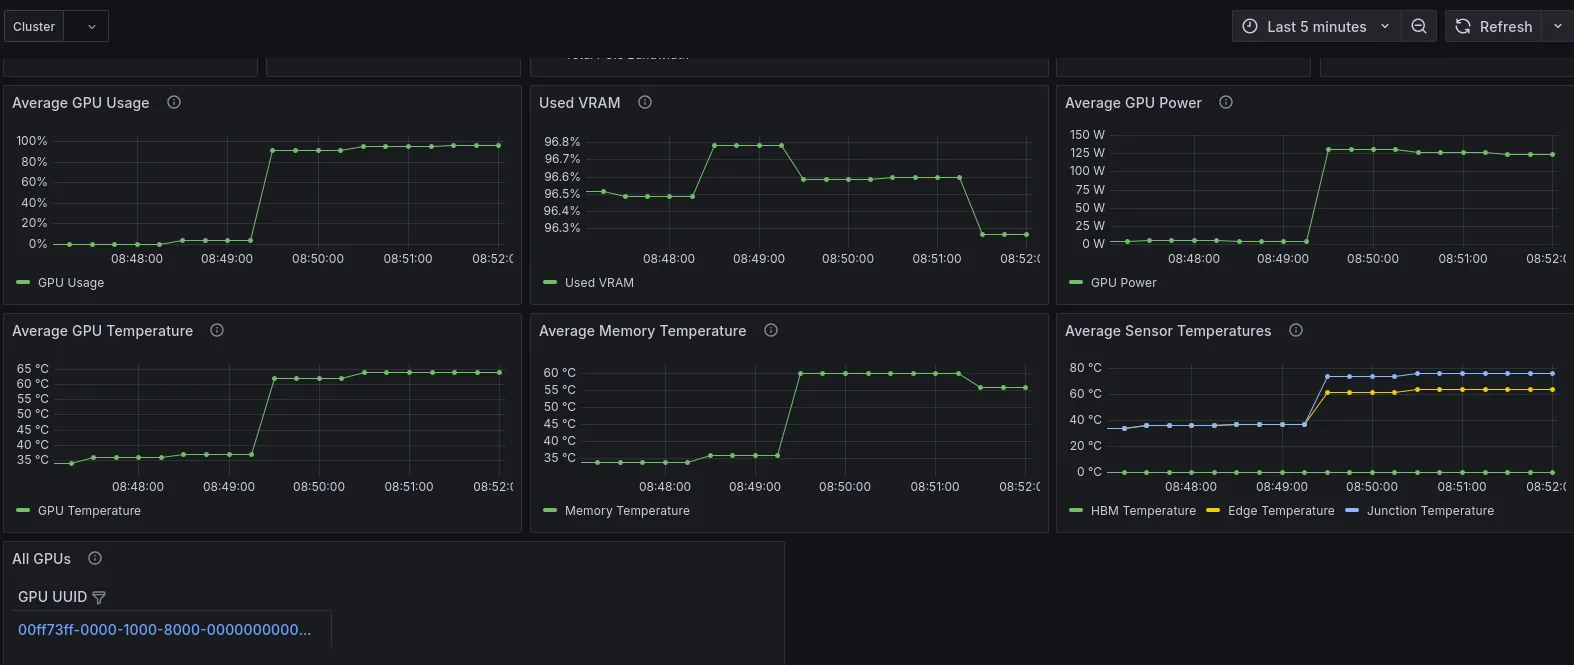
Conclusion
- I was able to setup monitoring for my PC in both OS (Windows and Linux) with focus on GPU
- Setting up windows service is a bit tricky especially if you don’t really understand the Windows API
Future Work
- I missed the crucial step of setting up good old prometheus exporter for my Linux machine
- Setup proper dashboard for Linux
- Try out a bunch of other LLM models